| 来自:http://blogs.mathworks.com As an application engineer I showed MATLAB to a lot of people. Occasionally when I presented graphics capabilities someone would ask how to make plots where the X and Y axes lines go through the origin. You know: the way we learned to draw them in school. By default MATLAB puts the X axes on bottom and the Y axes on the left.
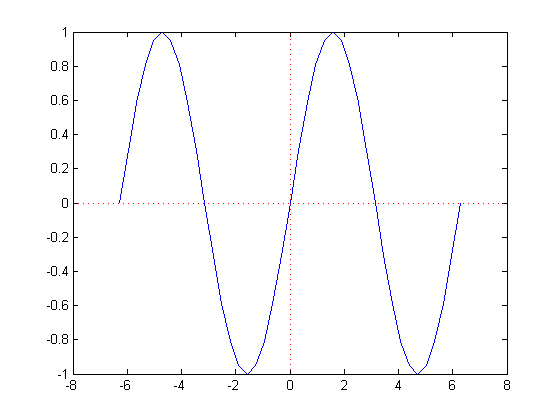
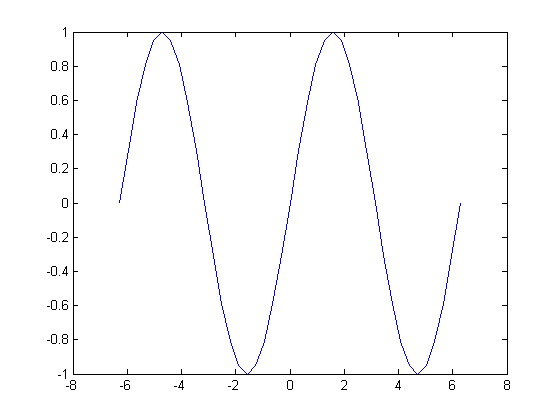 While the xAxisLocation can be set to top, and the yAxisLocation can be right, neither has an origin option for example. So, instead, I usually suggested drawing lines through the origin. In fact, prior "Pick of the Week" star Brandon Kuczenski made that trivial with hline and vline.
 Not satisfied? Neither was Shanrong. Hence, PlotAxisAtOrigin.
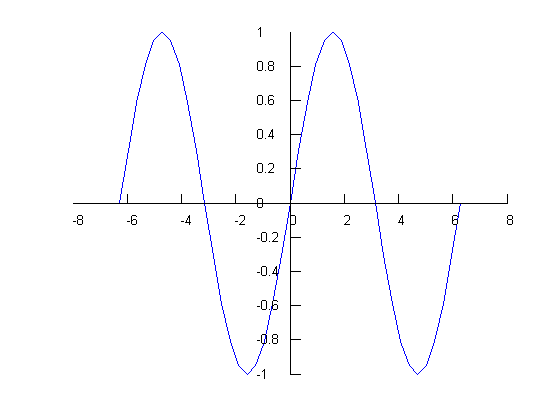 代码:[attach]40403[/attach] [attach]40404[/attach] [attach]40405[/attach] |
GMT+8, 2025-2-19 05:58 , Processed in 0.070533 second(s), 15 queries , Gzip On.
Powered by Discuz! X3.4
Copyright © 2001-2021, Tencent Cloud.
